Velocity Profile Measurement Equipment
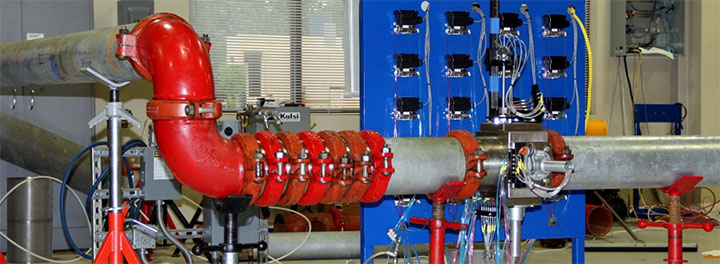
KEI™ flow loop facility is located in Sugar Land, TX. The main test section consists of a rapidly reconfigurable test section piping, a 7,500-gallon reservoir, a 180 HP diesel engine-driven variable speed centrifugal pump, and all associated piping for the actual test sections. The flow loop can deliver 2,700 gpm and pressures up to 270 psig. This flow rate corresponds to a flow velocity of 30 feet per second in a 6-inch pipe. Additional pump equipment can be connected to the system to achieve higher flow rates.
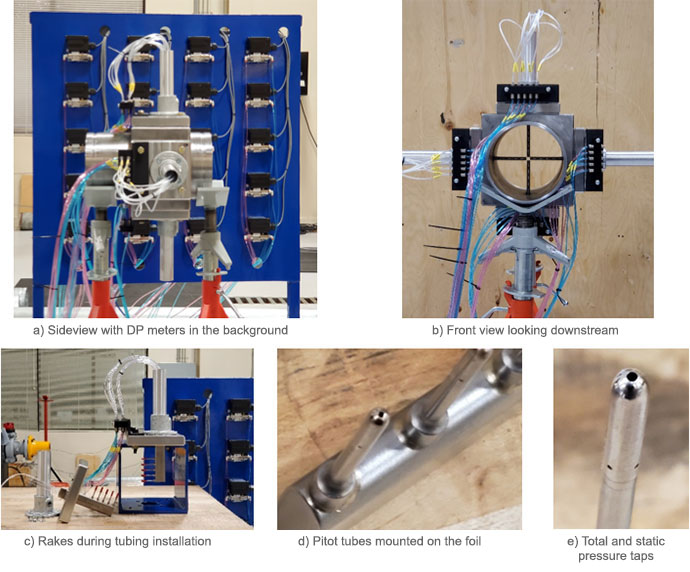
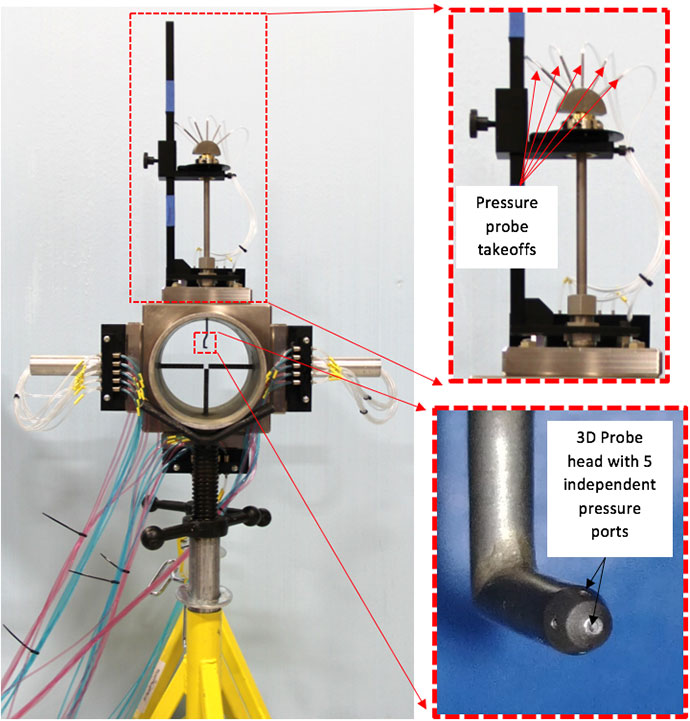
To facilitate specific project needs, KEI designed and assembled a two-axis, pitot-static tube rake (see Figure 1). The design of the rake holder also allows on rake to be replaced with a 3D pitot tube probe (Figure 2).
The pitot static tube rake assembly comprises four rakes, each rake having five pitot static tubes for a total of twenty pitot static tubes. Each of the pitot tubes is connected to a DP meter. The DP meters have a range of 0 psi to 5 psi. The DP meters have a measurement uncertainty of ±0.25% full scale.
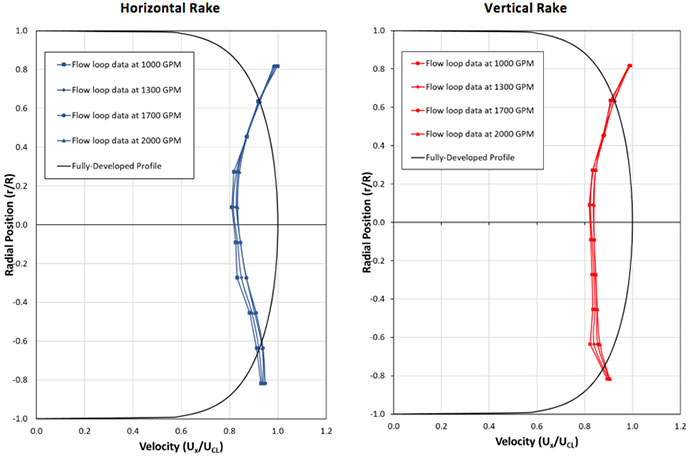
The pitot-static tube rake allows the velocity profile along two axes to be measured simultaneously. Example velocity profile data is provided as Figure 3.